> ## Documentation Index
> Fetch the complete documentation index at: https://docs.revolte.ai/llms.txt
> Use this file to discover all available pages before exploring further.
# DORA Metrics
> Monitor your team's software delivery performance using industry-standard DORA metrics.
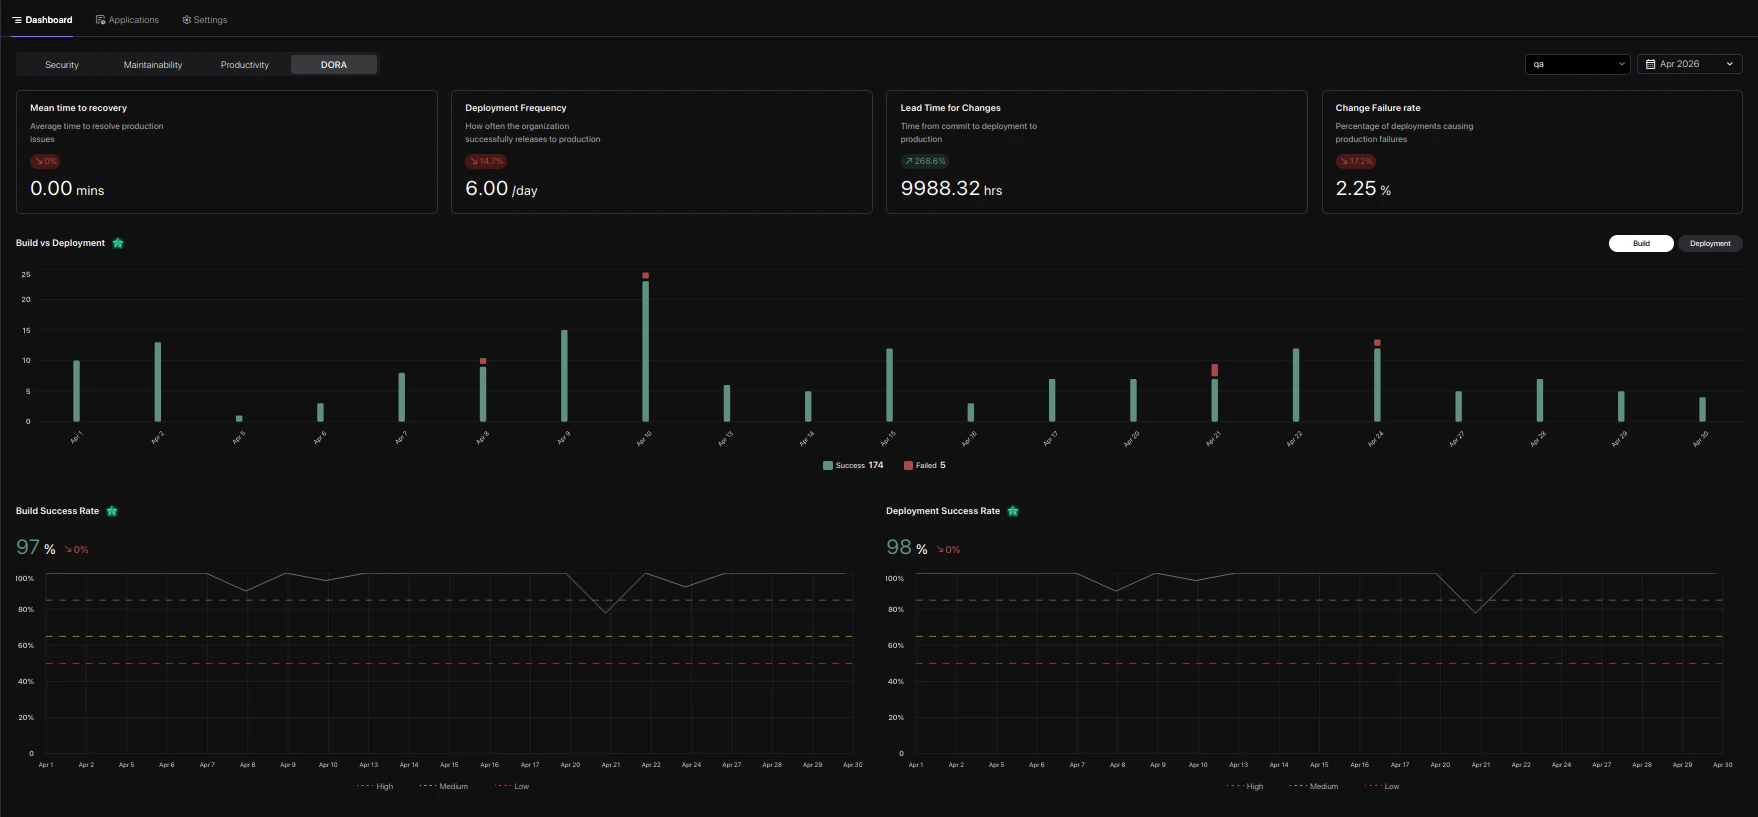
The Revolte Dashboard provides a comprehensive view of your software delivery lifecycle through **DORA (DevOps Research and Assessment)** metrics. These metrics help teams measure their velocity, stability, and overall effectiveness.
 ## Key metrics
Revolte automatically tracks the four key DORA metrics across your production services.
### 1. Deployment frequency
**How often the organization successfully releases to production.** High-performing teams aim for frequent, smaller deployments to reduce risk and deliver value faster.
### 2. Lead time for changes
**The time from commit to deployment to production.** This metric highlights bottlenecks in your development and deployment pipeline.
### 3. Change failure rate
**The percentage of deployments causing production failures.** A lower rate indicates more stable releases and robust testing processes.
### 4. Mean time to recovery
**The average time to resolve production issues.** This metric reflects your team's ability to respond to incidents and restore service quickly.
***
## Performance insights
Beyond the core DORA metrics, the dashboard provides granular insights into your build and deployment health.
Track the percentage of successful builds. High success rates indicate a stable CI process.
Monitor the reliability of your deployments as they move to production.
### Build vs deployment trends
The dashboard includes a detailed timeline of **Builds vs Deployments**, allowing you to visualize:
* **Success vs Failure**: Identify patterns in build or deployment failures.
* **Volume Correlation**: See how build frequency correlates with deployment volume over time.
***
## Using the dashboard
Access the DORA Dashboard from your Revolte workspace to:
* **Filter by Environment**: Switch between `production`, `qa`, and other environments to see stage-specific metrics.
* **Time Range Selection**: Analyze performance across specific months or custom timeframes.
* **Service-Level Insights**: Drill down into metrics for individual web applications and services.
Consistent monitoring of DORA metrics is the first step toward building a high-performing engineering culture. Use these insights to drive process improvements and automate bottlenecks.
## Key metrics
Revolte automatically tracks the four key DORA metrics across your production services.
### 1. Deployment frequency
**How often the organization successfully releases to production.** High-performing teams aim for frequent, smaller deployments to reduce risk and deliver value faster.
### 2. Lead time for changes
**The time from commit to deployment to production.** This metric highlights bottlenecks in your development and deployment pipeline.
### 3. Change failure rate
**The percentage of deployments causing production failures.** A lower rate indicates more stable releases and robust testing processes.
### 4. Mean time to recovery
**The average time to resolve production issues.** This metric reflects your team's ability to respond to incidents and restore service quickly.
***
## Performance insights
Beyond the core DORA metrics, the dashboard provides granular insights into your build and deployment health.
Track the percentage of successful builds. High success rates indicate a stable CI process.
Monitor the reliability of your deployments as they move to production.
### Build vs deployment trends
The dashboard includes a detailed timeline of **Builds vs Deployments**, allowing you to visualize:
* **Success vs Failure**: Identify patterns in build or deployment failures.
* **Volume Correlation**: See how build frequency correlates with deployment volume over time.
***
## Using the dashboard
Access the DORA Dashboard from your Revolte workspace to:
* **Filter by Environment**: Switch between `production`, `qa`, and other environments to see stage-specific metrics.
* **Time Range Selection**: Analyze performance across specific months or custom timeframes.
* **Service-Level Insights**: Drill down into metrics for individual web applications and services.
Consistent monitoring of DORA metrics is the first step toward building a high-performing engineering culture. Use these insights to drive process improvements and automate bottlenecks.